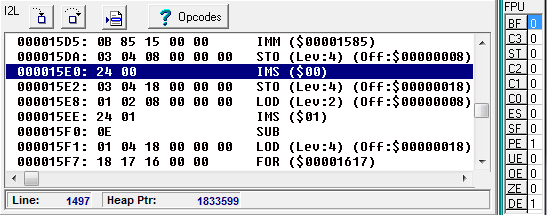
The I2L Panel appears in the bottom right-hand panel, and is only visible when the Show I2L check box is enabled. The I2L Panel shows a disassembly of the I2L code used in the program and highlights the current I2L opcode being executed. (Click here for a detailed description of I2L opcodes. You can also view a static version of the I2L disassembly that can be copied and saved to a text file.)
The highlight moves every time an instruction is executed. If an XPL source line is executed from the Source Panel, the highlight is moved to reflect the new program position. Since executing a single line of XPL code may execute multiple I2L opcodes, the highlight may move over multiple lines of the I2L disassembly.
You also have the option of executing individual I2L opcodes. When an individual I2L opcode is executed, the Source Panel, execution point highlight and cursor column are also updated to reflect the position in the I2L disassembly.
Stepping. The Stepping operations are controlled by the toolbar buttons at the top of the panel. Here is a detailed description of each operation:
|
Step Over Button. Pressing the Step Over button causes the debugger to step forward one line of I2L code while staying at the same subroutine level. If the Execution Point is on a subroutine call, the subroutine is executed at full speed and the execution point will stop on the next line of code at the original level. If you hold down the button, the action will auto-repeat. This makes it easy to rapidly step through large blocks of code.
|
|
Step Into Button. Pressing the Step Into button causes the debugger to step forward one line of I2L code and will enter any subroutine called. In other words, if the Execution Point is on a subroutine opcode, the program enters the subroutine and stops on the first line in the subroutine. If you hold down the button, the action will auto-repeat. This makes it easy to rapidly step through large blocks of code.
|
|
Show Execution Point Button. Pressing this button will scroll the I2L Panel to the Execution Point so the highlight is visible. This useful when you've been looking through the code and have scrolled away from the Execution Point. |
Line. This display shows the line number in the I2L code.
FPU. The far right column shows the current state of the Floating Point Processor status bits. Knowing their values can sometimes help debug floating point issues. Here is a description of each item:
Flag |
Description |
Bit # in control word |
||||||||||||||||||||||||||||||||||||||||||
|
|
|