The Profiler enables you to optimize your code for speed and efficiency. The Profiler shows where the program is spending most of its time so you can focus your optimizing efforts on areas that will produce the biggest results. You can access the Profiler by selecting the Debug -> Profiler option from the menu bar.
How It Works. The Profiler works by running the program one line at a time and measuring the amount of time that each line takes to execute. It keeps a record of every line of code it executes. If a line is executed more than once, it keeps a record of the total time it spent on the line and the number of times it visited the line. This gives a complete picture of where the program spends its time and where the bottlenecks may be.
While the program is running, the Profiler is gathering information about it. Since the Profiler adds overhead to the program, the program will execute slower, but all the times will be accurate because the program executes each line of code at its full speed.
When the program finishes or when you press the Stop button, the Profiler displays the information it has gathered.
Here is a description of the information:
Line Number. This is the line number that corresponds to the data that was collected. Double clicking on a line in the Profiler will take you to the corresponding line in the source code. |
|
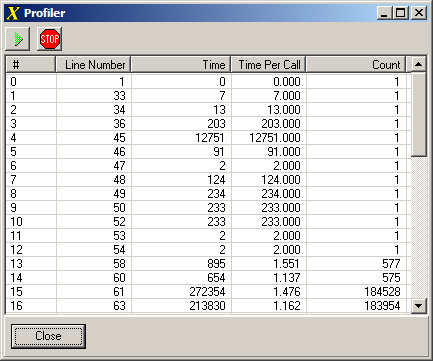
Time. This is the total time in microseconds that the program spent on this line of code. The time value is the combination of the time it takes to execute the line and the number of times the line was executed. Looking for lines with large time values lets you focus on portions of the code that are the best candidates for optimization.
Time Per Call. This is the time in microseconds it takes for the language to execute the line of code one time. This tells you which lines are slowest. Looking for lines with large time values lets you focus on portions of the code that are the best candidates for optimization. However, even if a line is slow, if the program doesn't call the line many times, the slow time will not matter.
Count. This item displays the number of times the line of code was executed. This tells you which part of the code the program is spending most of its time on. Looking for lines with high counts lets you focus on portions of the code that are the best candidates for optimization.
Sorting. Each column of numbers can be sorted by clicking on the header at the top. The sort brings the slowest lines in the various categories to the top of the list. This is especially useful for programs that have thousands of lines of text.