|
|
|
Preliminary Morphing |
| III. Preliminary Morphing. Morphing is the process
of distorting a sketch-map image so the Station locations in the
sketch-map match those in the survey data. The program moves the stations and
all the nearby pixels so the passage walls and floor details move with
the stations. The effect trails off with distance so that details away
for the stations are unaffected. This produces a smooth adjustment
almost as though ithe map were drawn on rubber.
In the process of editing the images, we will be morphing the
sketch-maps
twice. The first time is to fix local problems with individual
sketch-maps.
Later, after we merge all the sketch-maps, we will do a second morph to
fit the whole survey to the combined sketch-map. This two-step process
isolates the biggest distortions to small areas and creates smoother
passage walls and floor detail. |
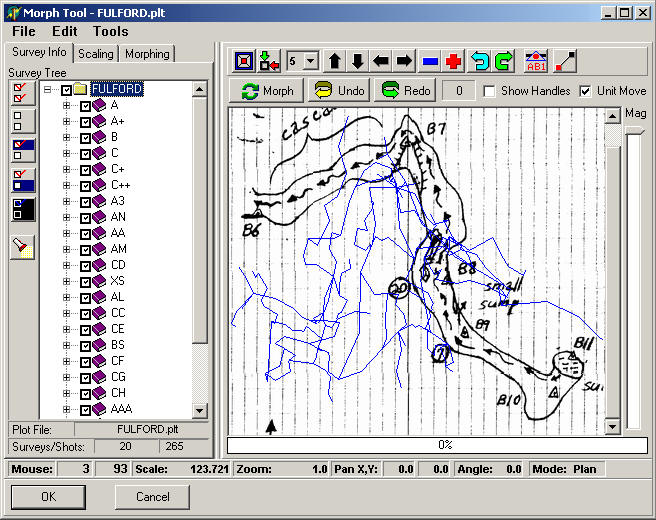
| With the image loaded in the main window, press the
Morph Button. This will bring up the Morphing Tools. |
|
 |
|
A. Load Plot File.
The first step in the
morphing process is to load the plot file associated with the sketch-map. Use the "File -> Open Plot File" option on the menu bar to do this. |
| After the file has been loaded, a plot of the cave will
appear on top of the image. It will be scaled to fit within the size of the
image. If the image is large, you may have to scroll the image to see
it. On the left side, you will find a hierarchical tree of all the
sections, surveys and shots in the cave. The boxes next to each item
control which items are displayed. When a file is first loaded, all
boxes will be checked so the whole cave will be displayed. |
|
B. Rotation. If your cave was compiled so that
the orientation of the plot matches the sketch, you shouldn't need to do
any rotating of the cave. If for some reason, the cave plot and the
sketch don't match, you can adjust the rotation of the survey so they do
match. For example, if the sketch-map was oriented to True North,
but the survey data was not, the plot and the sketch will not match.
(For the survey data to oriented to True North, declinations must be
included with the data) While it is always
better to compile the survey so the plot file matches the sketch map,
there are some instance where this is not possible. For example, you
might only have the plot file in which case, you could not recompile the
data. If this is the case, you can rotate the plot now so it matches the
sketch map.
| To deal with any
discrepancy between the plot and the sketch, you will need a
declination value for the cave. The Compass Project Manager can
calculate this value for you base on the date and geographic
location of the cave. (Refer to the Project Manage help for more
information about declination and True North.)
To compensate for magnetic declination, you can use the rotation buttons
to rotate the line plot relative to the sketch map. You can use the Increment
Tool to change the step size of the rotation button, so you can
precisely control the rotation angle. The rotation angle will appear in the Angle
display in the bottom Status Bar. |

|
|

|
|

|
|
| C. Positioning and Zooming. At this point, you
want to position and zoom the cave so the survey shots fall close to
their positions in the image. What you are trying to do is move
the cave quickly to the proper proper size and location before we do the
precision scaling and positioning. |
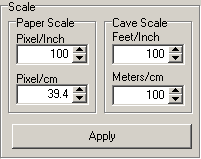
| When the plot file is first read, it is
given an initial scale that will fit the plot on the screen. The program
defaults to a Paper-Scale of 100 feet/in (39.4 cm/in). If you have used
a different Paper-Scale, you should change it now to calibrate your
zooming operations. To do this, select the
Scaling Tab in the left-hand panel. Just enter the new value in the
Pixel/Inch or Pixel/cm box and bit apply. It is not necessary to change
Cave Scale at this point, since we will be manually zooming to set a
rough scale.
|
 |
| While your zooming and
positioning the cave you will probably want to label the survey stations
so you can see the positions of survey stations. To do this press the
Label Stations button. |
 |
| The zoom button allows you
to visually and rapidly set the approximate scale of the cave. In most
instances, you will be zooming into a small section of the cave. As you
press the Zoom-In button, you will see the cave passages getting longer.
At the same time, if you watch the Scale value at the bottom of the
window, you will see it getting smaller. As the value get close to the
target scale, you can stop pressing the zoom button. |
 |
| At the same time, you can move the cave by dragging it
with the mouse. This allows you to quickly position the survey stations
so they close to their proper position on the sketch map. Alternating
between zooming and moving will allow you to get very close to the
proper position with very little effort. |
|
D. Set Precise Scale. When the
stations are very close to their proper position, you can set the exact
scale of the plot to match sketch-map. To do this, select the Scaling
Tab in the left-hand panel.
The option allows you to set both paper scale (in
pixels per inch or centimeter), and the cave scale (in
Feet/Inch or Meters/cm.) In the case of our example, we scaled the
images to 100 dpi and the sketches were drawn at 20 ft/inch so we just
enter those values in the boxes. When the
values have been correctly set, press the Apply Button and the plot
lines will be scaled to these values. At this
point your probably want to do some fine adjustments to cave position.
Because of the errors in the sketch-map, you won't be able to get the
stations to match perfectly. Generally the best you can do is all them
fairly close but none of the perfect. |
|
|
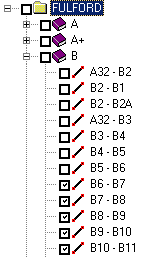
E. Select Survey Shots. At this point, we only
want to display the shots/stations that appear on our sketch-map.
It is important to exclude all other
shots. This done using the Survey Tree in the left-hand panel. |
| First, deselect everything in the Survey
Tree by pressing the Clear All button. |
 |
| Next locate the shots you are interested in
by scanning through the tree. Click on the little plus and minus signs
next to each item to expand or contract that branch of the tree.
When you have located
the shots that correspond to your sketch-map, check the boxes next to
them. If you have trouble finding the shots you want, you can use the
search tool to find the correct shots. Also, if your sketch-map covers a full survey,
you can save some time by checking the box for the survey and ignoring
the boxes for the shots.
The important thing is that only the shots that are on your
sketch-map
should be checked. Otherwise, the additional shots may cause problems
with the morphing. |
 |
|
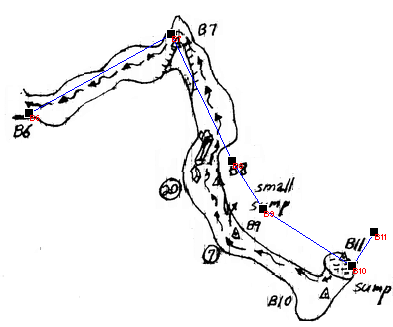
F. Position Stations. The shots should now be
close to their proper positions. However unless the sketch-maps were
perfect, there will errors between the plot and sketch-map. To fix those
errors we need to tell the program where the errors are. We do this by
moving the stations to the station-marks on the sketch-map. |
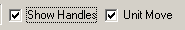
| First, enable the "Show Handles" option.
The program will now display a square black "handle" at each station
location. |
 |
| You can click on the handles and
drag them into new locations.
(Note: when the handles are enabled, the plot as whole cannot be moved;
only the individual stations can be moved. Disable this options to move
the whole plot.) To tell the program how to morph the image, you drag the station to
corresponding location on the sketch-map. The program uses these
location to decide how to move the sketch so the stations are in the
proper location.
You will notice in the picture to the right that stations B8, B9, B10
and B11 are a long way from the proper location. To fix this, I will
drag the black squares so the fall right on top of the corresponding
station. |
 |
|
If you enable the "Unit Move" option, all the "down-stream" stations
will move together. This can be useful when there is an error at a
single survey station and the rest of the shots are fine. |
|
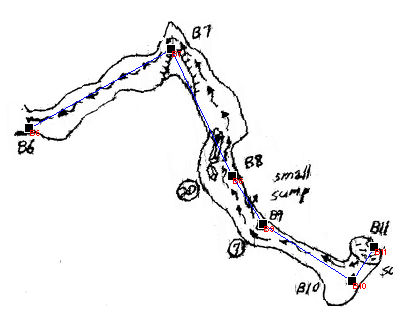
G. Morph The Sketch. You can now press the
"Morph" button and the program will adjust the image so all the stations
are in the correct position. In the image to the right, you can see how
the program has pull part of the image up and to the right so that B8, B9, B10 and B11
are now in the proper position relative to survey data.
If you are not happy with the resulting morph, you can press the Undo
button and try again. For example, it is fairly common for the program
to push parts of the passage off the page. If this happens, you can undo
the morph and then use the "Tools -> Resize" option on the
menu bar to make room around the edge of the image. |
|
| When you are satisfied with the morph,
click the "OK button. This will take you back to the Main Window.
|
 |
| Finally, save the image by clicking
on the Save Button. |
|
|
IV. Repeat. You should repeat steps II through
III for every sketch-map image in your survey, save each one to a
separate file. |
|
|
|