A good loop will have errors that only come from random variations in the measurements. Since random errors have a certain size and pattern to them, we can make a prediction as to how big the errors should be for any particular loop. Loops that follow a pattern and match the prediction are probably good. Loops that don’t follow the prediction are probably bad.
The prediction is based upon how accurately each instrument can be read. For example, if you can read a compass accurately to within one degree, every azimuth reading will have an "uncertainty" of about one degree. Each compass, tape measure and inclinometer has a different level of "uncertainty" associated with it. For example, experiments on a test survey course show that Suuntos have about a two-degree accuracy under the best circumstances. Also, some surveyors are better than others and some caves are more difficult than others. All this adds up to varying levels of uncertainty in the survey measurements. For this reason, the blunder program allows you to select different levels of uncertainty for azimuth, length and inclination.
If you combine all these uncertainties around the loop, you will get a prediction of what the total error should be if all the errors are random. Notice that each shot has a different effect on the outcome. For example, if the shot is heading north, a one-degree azimuth uncertainty adds to the east/west errors. If the shot is heading east, the uncertainty adds to north/south errors. If you have loop with more shots in the north/south direction, you would expect the loop to have more east/west error. For this reason, every measurement in every shot is used to calculate the predicted error level.
The resulting prediction is the "standard deviation" for the loop. Standard deviation is a statistical concept that is used to examine random information. Since the errors in a loop should be random (unless there is a blunder or systematic error), standard deviation is a good way to predict whether the loop has a blunder. The best way to understand standard deviation is to look at a graph:
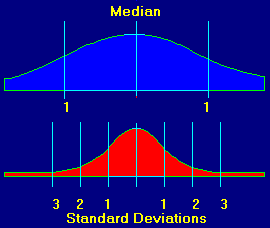
These graphs show a typical set of random events. They are famous "bell shaped" curves that are usually taught in high school. They give a visual representation of how the events are distributed. These events could be things like rainfall in Florida, wins on a roulette wheel or cave survey measurements. The center of graph is called the median and it is the average of all the events. You will notice that most of the events fall into the middle of the graph. Also, as you move to either edge, there are fewer events. At the bottom the graph, standard deviations are marked. They are numbered going away from the center. This is because we care about how far a particular measurement is from the average.
Standard deviations are a measure of how much variability there is in the data. The more variability, the larger the standard deviation will be.
Look at the bottom graph. You will notice that the data in this graph is clustered tightly around the center. This means that the data has less variability. You can see that the standard deviations are smaller. If this were cave data, the tight clustering would mean that the cave was surveyed more carefully or with better instruments.
When we are looking for loops with blunders, we look for loops whose errors fall on the edge of the bell shaped curve. For example, if we have a loop whose error falls "three standard deviations from the mean," we would be very suspicious that the loop had a blunder. In other words, the standard deviation for a loop gives you a range of values that can be expected if the errors are random.
Large Errors Aren't Always Blunders. As mentioned before, random errors tend to cancel each other out. For example, sometimes you will read the compass half a degree positive, sometimes half a degree negative and sometimes right on. If you add up all these positives and negatives, the resulting error will be very small.
There is, however, a small chance that the errors will fall in such a way that there will be a larger error. Sometimes, by random chance, most your compass readings will end up half a degree negative. This will give you a larger error even though there is no real blunder. It's like flipping a coin. Most of the time, you expect 50% head and 50% tails, but every once in a while, you could get 20 straight tails in a row. If you get 20 straight compass readings that are a half a degree low, the error will be disproportionally large.
Probabilities and Odds. So another way of understanding errors is to look at them in terms of probability. As the standard deviation goes up, the loop is more likely to be blundered. For example, if the standard deviation is greater than 2, there are only 5 chances in 100 that it is not a blunder. But if the error is greater than 3 standard deviations, there are only 3 chances in 1000 that it is not a blunder. The chart below gives more exact numbers for various standard deviations.
Standard Deviation |
Percent Inside |
Percent Outside |
|
|
|
0.5 |
38.30 % |
61.70 % |
1.0 |
68.26 % |
31.74 % |
1.5 |
86.64 % |
13.36 % |
2.0 |
95.44 % |
4.56 % |
2.5 |
98.76 % |
1.24 % |
3.0 |
99.74 % |
0.26 % |
You can see that if you have cave data with no blunders and only random errors, the loop error should fall within one standard deviation most of the time (68%). If you have a loop that is three standard deviations away from the mean, there are only two chances in 1000 that there isn't a blunder. However, it is important to realize that even if the error is 3 standard deviations, there is still a small chance that the loop has no blunders.