Compass gives you great flexibility in organizing your cave survey data. Because of this flexibility, Compass projects can get complicated. In order to simplify the process of creating and maintaining projects, Compass displays the organization of your survey project in an easy-to-understand "tree" diagram. The 'tree' diagram shows you all the caves, files, folders and surveys that make up your project.
The diagram is called a tree because it has “branches” like a tree. The important thing about a tree diagram is the way in which the branches are connected together. Each branch has a "parent" branch, which ultimately connects back to the "root" of the tree. This is very similar to the way you organize cave surveys.
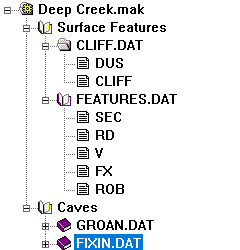
TREE NODES. If you look carefully, you will see that the tree diagram has four levels: the project file, folders, the data files and the individual surveys. Each project, data file and survey in the tree is called a "Node." Each node is represented by a small icon that symbolizes the type of data in the node. You can also tell if the node has links or fixed stations associated with it by the kind of icon that appears next to it.
The tree diagram allows you to view and manipulate the survey data visually. When a particular node is highlighted, various different menus and buttons we be activated, which enables to manipulate the node. Likewise, right clicking on the Tree will bring up a popup menu that also allows you to manipulate the Tree. Here is detailed information about all the options for working with the Tree: