It is often useful to know exactly how execution has reached a certain point in the program. For example, when a runtime error occurs, the error messages will tell you where the error occurred, but nothing about the context and steps that led up to the error. Many low-level subroutines are called from dozens of different places, and the way a subroutine is called may be the cause of the error.
For this reason the IDE lets you view the path that the program took from any particular point in the program. To view this information, select the Debug -> Stack Dump option from the menu bar. This will bring up the stack dump dialog.
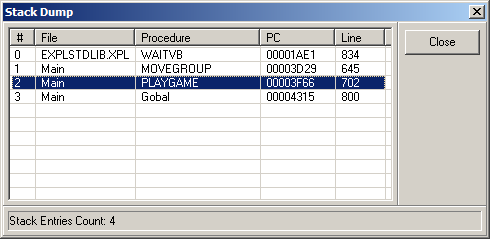
Stack Dump Dialog. The Stack Dump Dialog displays a list of all the subroutine calls that have been pushed onto the I2L stack. Since the I2L stack records the addresses of every subroutine call, the list represents a history of how each subroutine was called and the path that execution took to reach the current point in the code.
Stack Dump Items. The Stack Dump List displays the File and Procedure from which a subroutine was called, along with the I2L PC and the corresponding Line number.
|
|
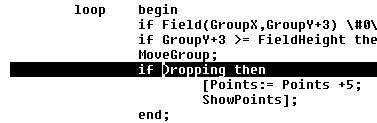
Going To A Line. Double clicking on a line in the Stack Dump will take you to the corresponding line in the Source Code Editor. If the Debug Console is open, double clicking will also take you to the corresponding line in the Debug Source Panel.
Double clicking usually takes you to the line after a subroutine call. For example, if you double click on the PLAYGAME procedure in the Stack Dump displayed above, it will take you to the point just after the MOVEGROUP procedure was called. This is because the stack always contains the return addresses of procedure calls, which always point to the next instruction. |
|
Using the Stack Dump. The Stack Dump is usually used in three situations:
1. Runtime Errors. When a runtime error occurs, the IDE automatically highlights the line in the Source Editor where the error occurred. At this point you can bring up the Stack Dump to see how the code execution reached the point where the error occurred.
2. Breakpoints. You can also display the Stack Dump after you've encountered a Breakpoint in the Debug Console. This will show you how the program reached the breakpoint.
3. Stepping. You can also display the Stack Dump while you are Single Stepping in the Debug Console. The Stack Dump is updated after each step, so you can keep track of where you are in the code and how you got there.