The following options control the analysis and appearance of the 3D Rose-Depth Diagram:
Minimum Length. The purpose of generating these graphs is to analyze the trends of the passages. Thus, when the program analyzes azimuths and inclinations, part of the assumption is that shots go in the same direction as the passage. However, in many surveys, the shots zigzag down the passage, with many shot running across the passage trend. For this reason, the program can be set to ignore shorter shots. The rational is that short shots are more likely to be cross-passage shots, whereas longer shots are likely to more closely match the passage trends.
To set the program to ignore shorter shots, set the “Minimum Length” option to a value like 3 meters. This will cause the program to ignore all shots less than 3 meters and only evaluate the longer shots. |
|
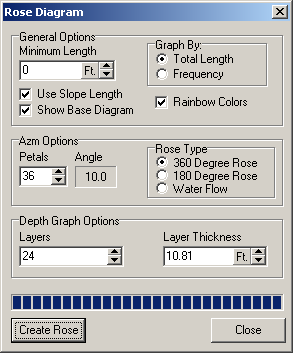
Use Slope Length. This option determines the way the program figures the length of each shot. If the "Slope Length" feature is turned on, the program uses the actual shot length as measured by the tape. If the "Slope Length" feature is turned off, the program converts the shot length to the horizontal distance as projected onto a horizontal plane. This means that higher angle shots are de-emphasized. The idea is that higher angle shots don't travel along the length of the passages and so don't follow the fracture patterns and geology of the cave. The feature only applies to the Azimuth Rose Diagrams and Depth Histograms. The Inclination Roses only use the Slope Length.
Show Base Diagram. When this option is enabled, the programs displays a “card” at the base of the Rose Diagram that show the directions and compass angles. This allows you to see the angle of each petal in the Rose.
Graph By Length/Frequency. This option controls how the sizes of the “petals” or bars on the graphs are determined. With the Length option, the size of the petal is determined by the total length of the passage at a particular orientation. With Frequency option, the size of the petal is determined by the total number of shots at a particular orientation. Graphing by Length tends to bring out patterns in long passage trends. Graphing by Frequency tends to emphasize small maze passages.
Rainbow Colors. This option causes the diagrams to be drawn with a set of 24 rainbow colors. The colors are arranged so that reds represent the highest areas and purples represent the lowest areas. This can make the individual bars and petals easier to see and make the graph more attractive.
Number Of Petals And Petal Angles. This option controls the number of "Petals" around the Rose diagram. As the number of petals around the rose increases, the width of each petal decreases. Narrower petals give a more detailed and precise display of the passage trends. The width of each petal in degrees is displayed to right of the number of petals.
360/180 Roses. When you make a survey shot, the compass angle depends on which direction you are surveying. For example, if you are surveying in an east-west passage, the compass angle could be 90 or 270 depending on whether you are going east or west. For this reason, the Viewer offers two types of Rose diagrams: 360 and 180 degree version. In the “360 degree Rose,” passages are graphed based on the direction they were actually surveyed. This give an arbitrary graph based on the whims of the surveyors rather than on the cave geology. In the 180-degree version, all angles greater than 180 are reversed and so all passages that are on same fracture-line are grouped together. This setting also does a similar reversal for the Inclination Rose Diagram.
Water Flow. This option allows you to see the direction water would flow in the cave. It is useful for analyzing how the cave was formed and later modified by water flow. Normally the 360-Degree Rose Diagram chooses an angle based on the direction the passage was surveyed. With the "Water Flow" option, the inclination of the passage is used to make all Petals point in the downhill direction. This means that the largest petals show the primary directions that water would flow through the cave.
Layers. This option controls the numbers of layers and the thickness of the layers in the Rose Diagram. More Layers means thinner layers and this gives you more finely detailed information about the distribution of passage depth. Fewer Bars mean thicker bands and this gives you more general information about the distribution of passage depth. You can individually adjust either the number of bands or thickness of each band, depending on your needs.