Cave passages often develop along fractures in the bedrock. As a result, cave passages can display a pattern that reflects the underlying geology and speleogenesis. For this reason, CaveX allows you to display 3D Rose/Depth Diagrams.
Rose Diagrams. A Rose Diagram is a circular graph that looks like the petals of a flower. Each petal represents passage direction. The longer the petal, the more passages in the cave that run in that direction. Unfortunately, the typical rose diagram does not show any information about the depth of the passage. As a result, you can miss major trends in passage direction because they only occur at a specific depth. |
|
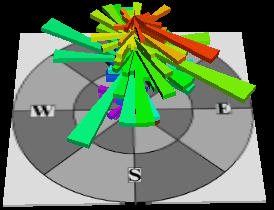
3D Rose-Depth Diagrams. The Compass3D Rose/Depth diagram shows both the depth and orientation of the passages. This allows you to see passage trends at various depth in the cave. They are also 3D objects, so they can be panned, zoomed and viewed from any angle.
Displaying A Rose-Depth Diagram. Before you can display a 3D Rose, you must load a cave plot file. Once the file is load, select the “Cave|3D Rose Diagram” option from the menu bar.
3D Rose-Depth Window. The program will now show the 3D Rose Window. There are several options that can be used to control the analysis and display of the passage trends. Once you have selected the options you want, just press the “Create Rose” button and the 3D Diagram will be created.