Complex Survey Based Plotting Options
Survey based plotting options allow you to color, highlight, mark, label
and excluded individual caves surveys. Look at this dialog box:
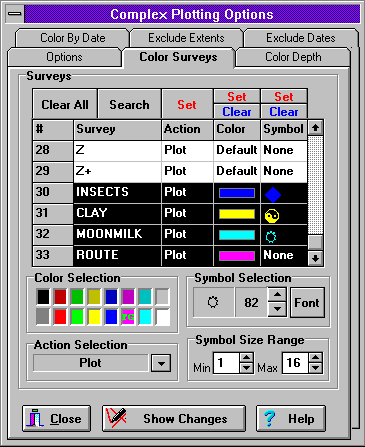
This dialog box is used to control the way individual surveys are plotted,
colored, marked and labeled. In the middle of the box is a list of all the
surveys in the cave.To the right of each survey is a set of actions, colors,
and symbols that can be applied to that survey. The actions include plotting,
excluding and labeling. You can also select an individual color for the survey
and a special symbol that can be used to mark cave features. The combination
of these options allow you to do things like label stations for a single
survey, color some survey and exclude others etc. In this image the surveys
labeled "Insects", "Clay", "Moon Milk" and "Route" represent special features
of the cave that have been inventoried as a part of the survey process.
GIS and Feature Labeling
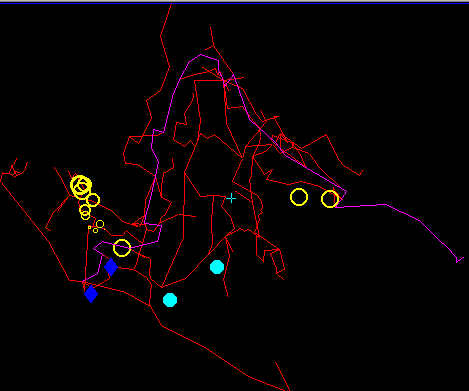
This image illustrates the use of the database and GIS features of COMPASS.
The diamonds, circles, and spots show the locations of insects, moonmilk,
and clay in the cave. You will notice that the circles have different sizes.
These circles mark the location of temperature samples taken in the cave.
The size of the circle represents the air temperature at that location. This
technique allows you to represent any numerical value associated with cave.
The purple line represents the main trade route through the cave. This feature
allows you to build color maps of routes through the cave. It can also be
used to represent any linear feature in the cave. These lines can cross surveys,
and even go outside cave passage through solid rock, to mark geologic trends,
faults, joints and any linear feature associated with the cave. These maps
are generated using the database features of COMPASS.
Click here for more information about CaveBase the
COMPASS database program.
|